Pioneering the Future of Analytics in Virtual Tours
Empowering Businesses with Enhanced Visualization and Performance
Advancing the Realm of Virtual Tour Analytics
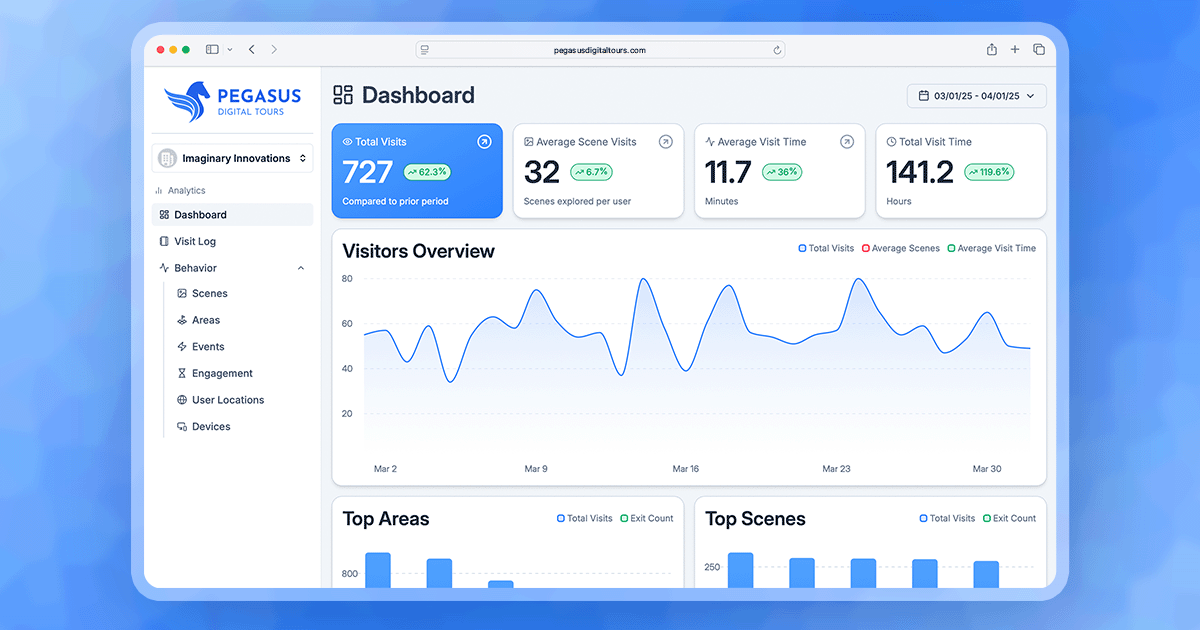
We are pleased to announce the release of our latest major update to the Analytics Dashboard, engineered to offer a superior user experience characterized by a refined interface and increased performance. This update marks a significant step forward, reaffirming our standing at the forefront of virtual tour technology.
Our focus remains on delivering practical, impactful solutions that allow enterprises to harness their data effectively. This comprehensive update introduces vital features designed to optimize user interaction and enhance data-driven decision-making.
Introducing Cutting-Edge Features
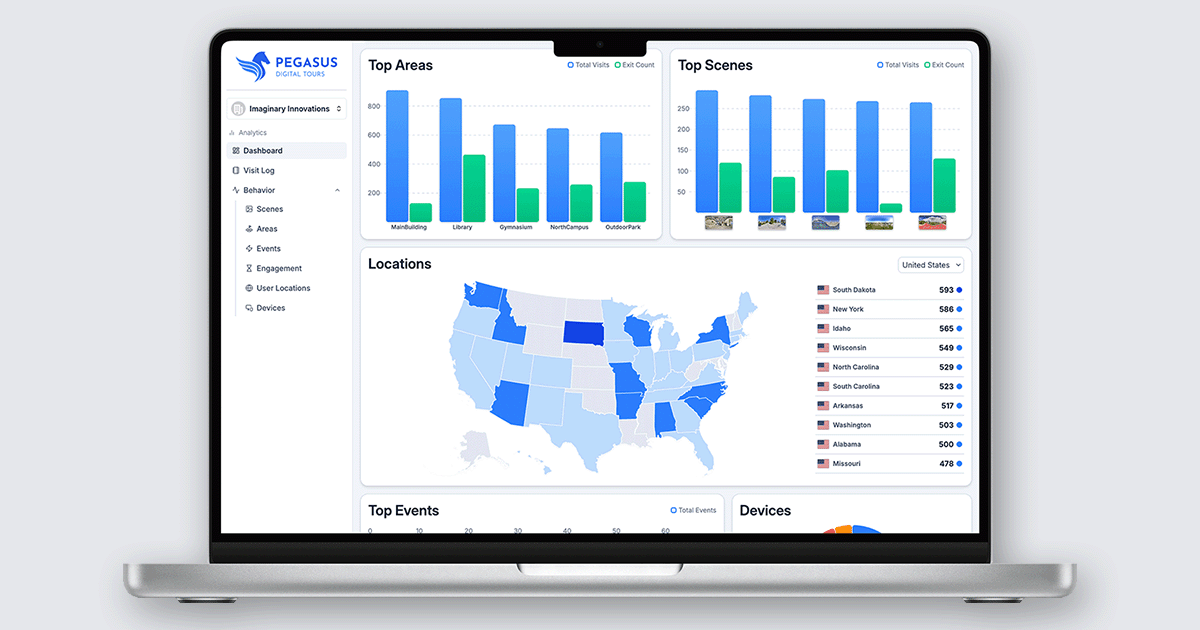
Our latest update introduces several pioneering features designed to enhance your data interaction and decision-making process. Leading the charge is the User Locations Map, a transformative tool that visualizes global engagement metrics with impressive clarity. By offering a comprehensive view of where users are interacting globally, this feature empowers businesses to pinpoint growth opportunities and refine their engagement strategies efficiently.
Equally impactful is the Top Scenes Bar Chart, which provides an elegant, detailed visual summary of user interactions. This chart highlights the most popular scenes, complete with associated imagery in the legend, enabling a deeper insight into viewer preferences and emerging trends, thereby fueling the creation of more engaging and impactful content.
Further enriching our platform is the introduction of Member Roles, a versatile feature that allows admin members to invite new users to the dashboard while customizing their access levels. This ensures that while admins have broad capabilities to manage and enhance tour features, general users maintain focused access restricted to analytics data. This thoughtful feature underscores our dedication to creating a flexible and personalized user experience, tailored to meet diverse business needs.
Achieving Balance Between Speed and Usability
With an improved UI and enhanced processing capabilities, the updated dashboard offers an intuitive interface that simplifies the complexity inherent in managing digital analytics. Users can quickly navigate through comprehensive datasets, enabling more efficient exploration and insight generation.
This upgrade embodies our dedication to delivering an analytics platform that is both powerful and accessible, enabling our clients to focus on leveraging data insights to achieve their strategic goals.
Laying the Foundation for the Future
This update is more than just an enhancement; it lays the groundwork for future innovations, setting the stage for a unified dashboard experience. We envision a future where clients can manage all aspects of their virtual tours from a single, cohesive interface, streamlining operations and enhancing functionality across the board.
Explore Our Latest Advancements
Experience the capabilities of the new Analytics Dashboard through our demo system available at Dashboard.PegasusDigitalTours.com. We are excited to support your business objectives with solutions that integrate seamlessly into your operational strategies.
About Pegasus Digital Tours
Pegasus Digital Tours is a pioneer in the virtual tour industry, dedicated to delivering high-quality, customized digital experiences that reflect clients' unique identities. With a focus on innovation and realism, Pegasus empowers businesses to engage their audiences through immersive technologies, ensuring every virtual experience exceeds expectations.